Get insight into your business processes with data-driven, statistical evaluations of all processes related to appointment and waiting time management.
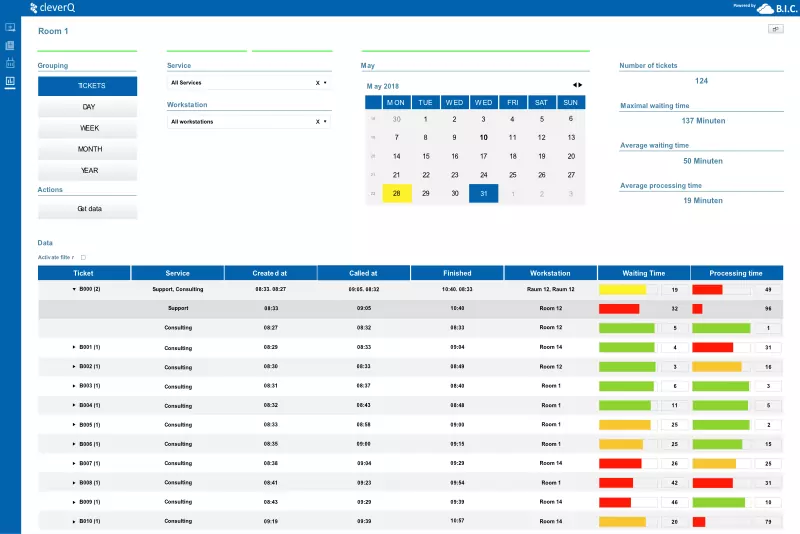
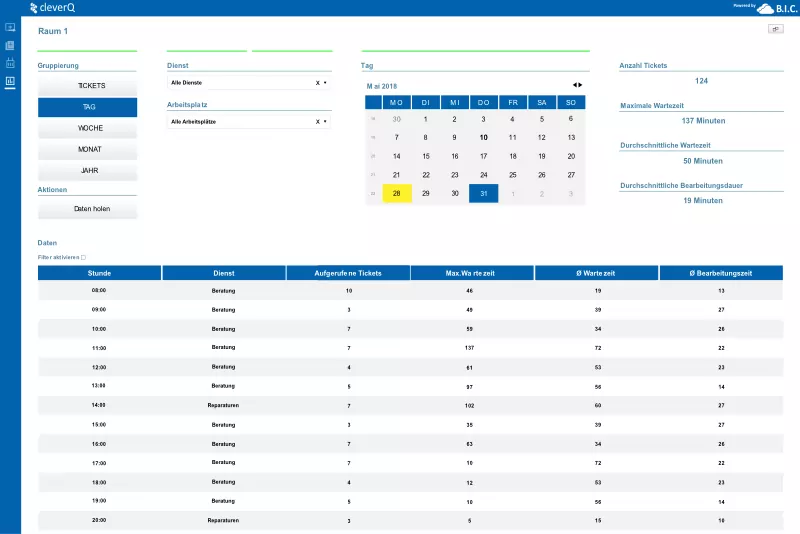
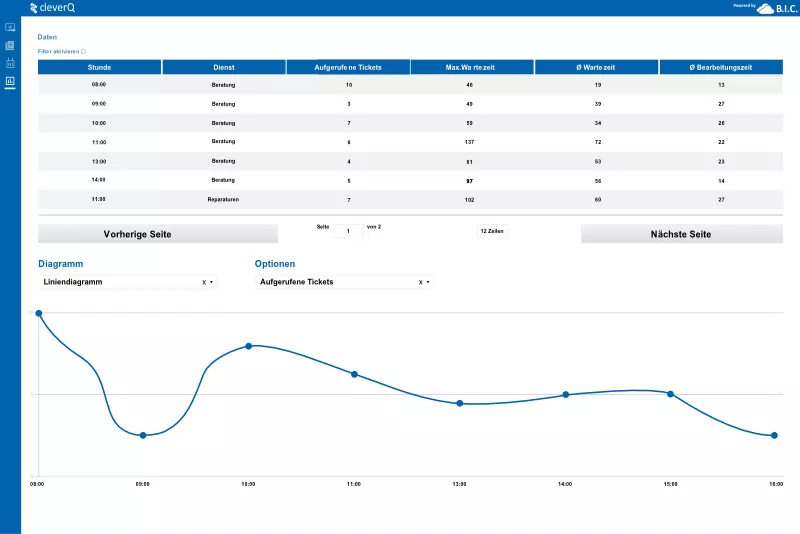
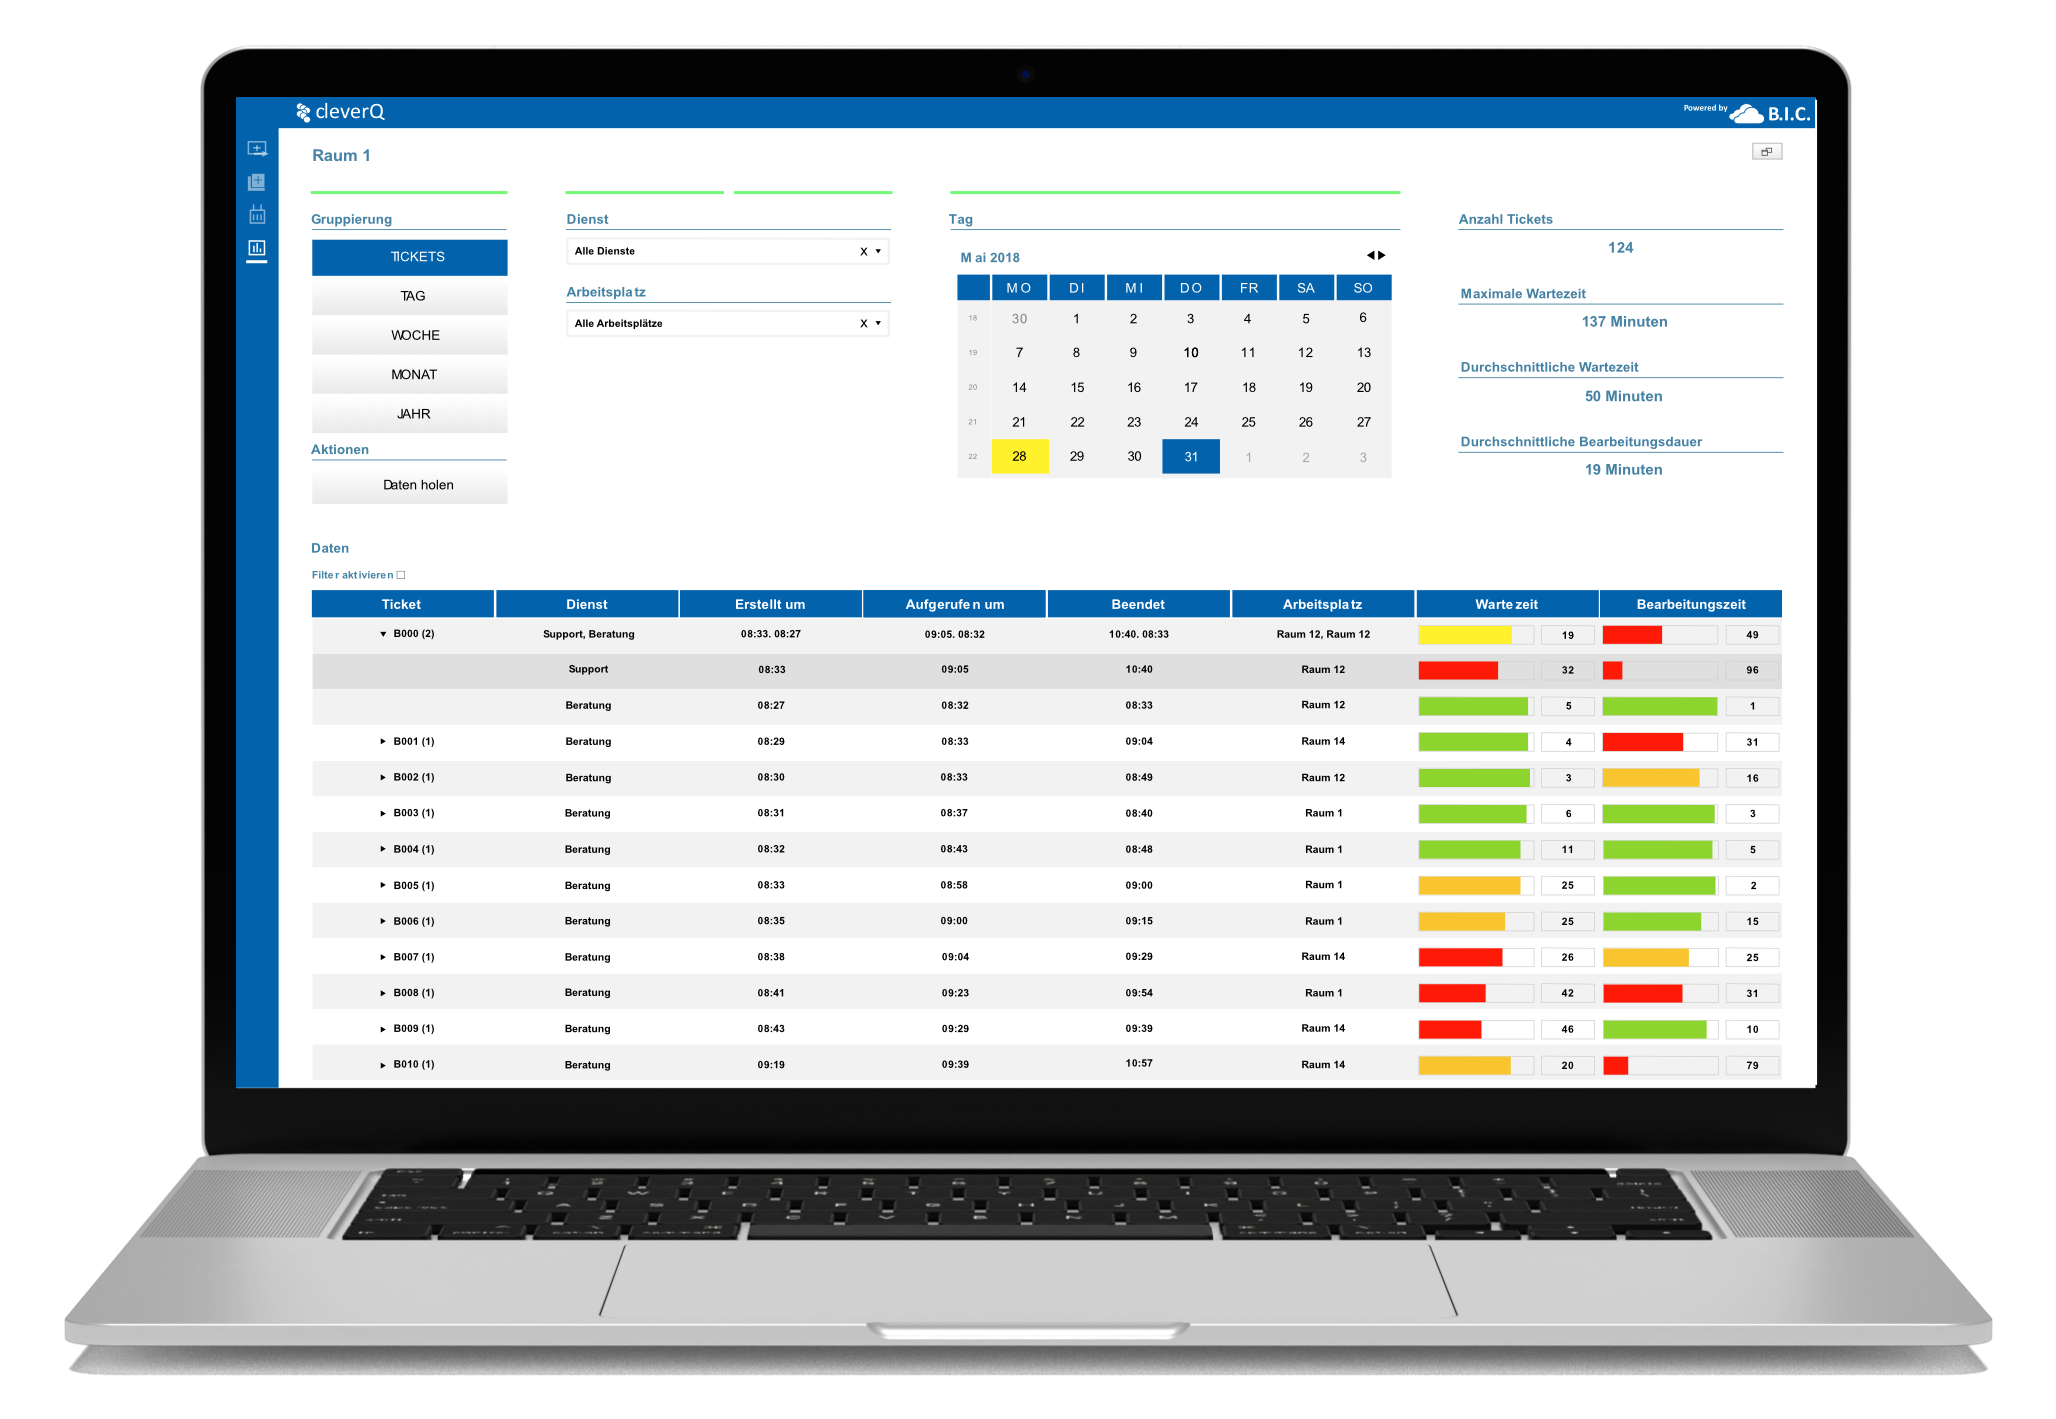
The statistics module creates attractive graphics of customer visit times in your organization with just one click. The display as bar chart, line chart or pie chart can be chosen freely and thus provides a convenient overview.
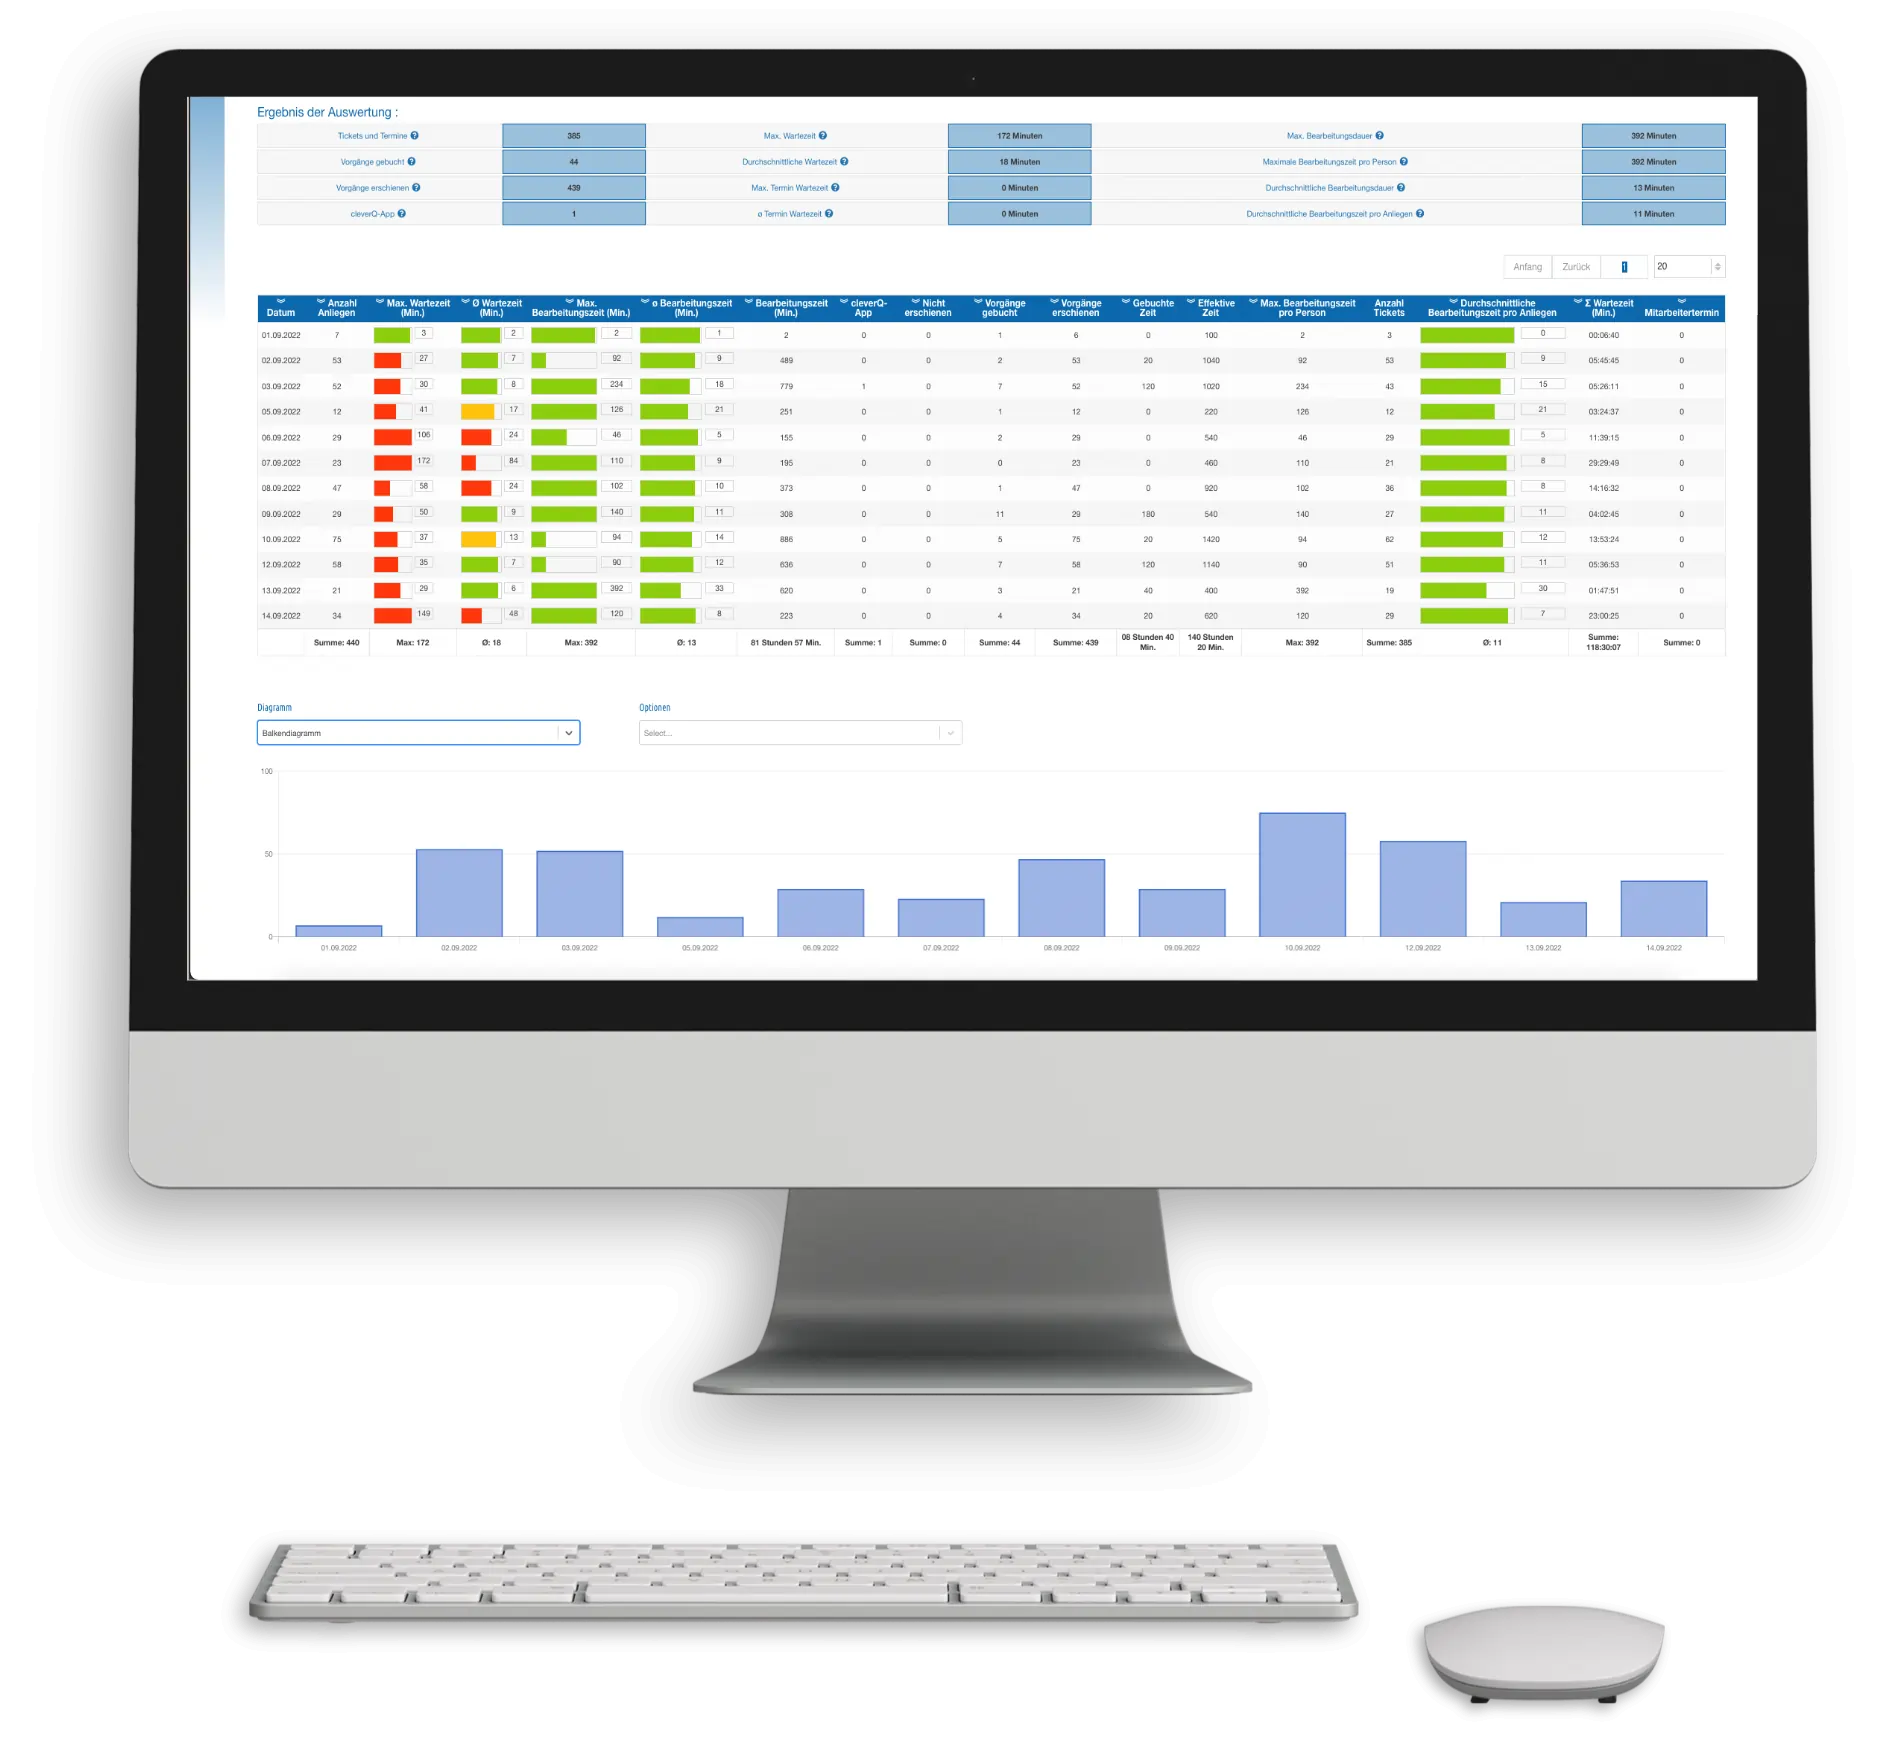
Get a detailed overview of your citizen/customer flows. Graphically generated evaluations of the most important process flows help you to view workload peaks, processing times or average values for waiting times. With these evaluations, you can make data-based decisions to improve customer service and employee efficiency. You can evaluate the following data with cleverQ Statistics:
A major advantage of cleverQ is its flexibility and scalability. With extensions for your appointment or queuing system, you can add useful functions with little effort.
cleverQ specializes in the areas of public authorities, finance,
utilities, healthcare, public transport, logistics and professional service providers.

(job centers, registration offices, citizens’ offices)
Benefit from centralized management of your appointment and walk-in customers with a customized system for government agencies.

(supermarkets, pharmacies, shopping centers)
Simple & reliable system for customer and queue control.

(handling, loading ramps, entrances and exits)
A modern appointment and waiting time management system to optimize your process control during arrival, registration, loading and unloading.

(public utilities, banks, insurance companies)
Benefit from centralized management of your appointment and walk-in customers with a customized system for utilities.
You would like to test cleverQ Statistics for your company or book it directly? Just send us a short message and we will get back to you immediately.