Modern appointment and waiting time management for your citizens & customers.
Your first step on the way to true digitalization with cleverQ.
Gain a competitive edge and offer your customers real added value.
Your first step on the way to true digitalization with cleverQ.
Gain a competitive edge and offer your customers real added value.
Job centers, citizens’ offices, registration offices and many other authorities and companies across Germany rely on cleverQ and benefit from the advantages of a central, digital system for appointment and waiting time management.
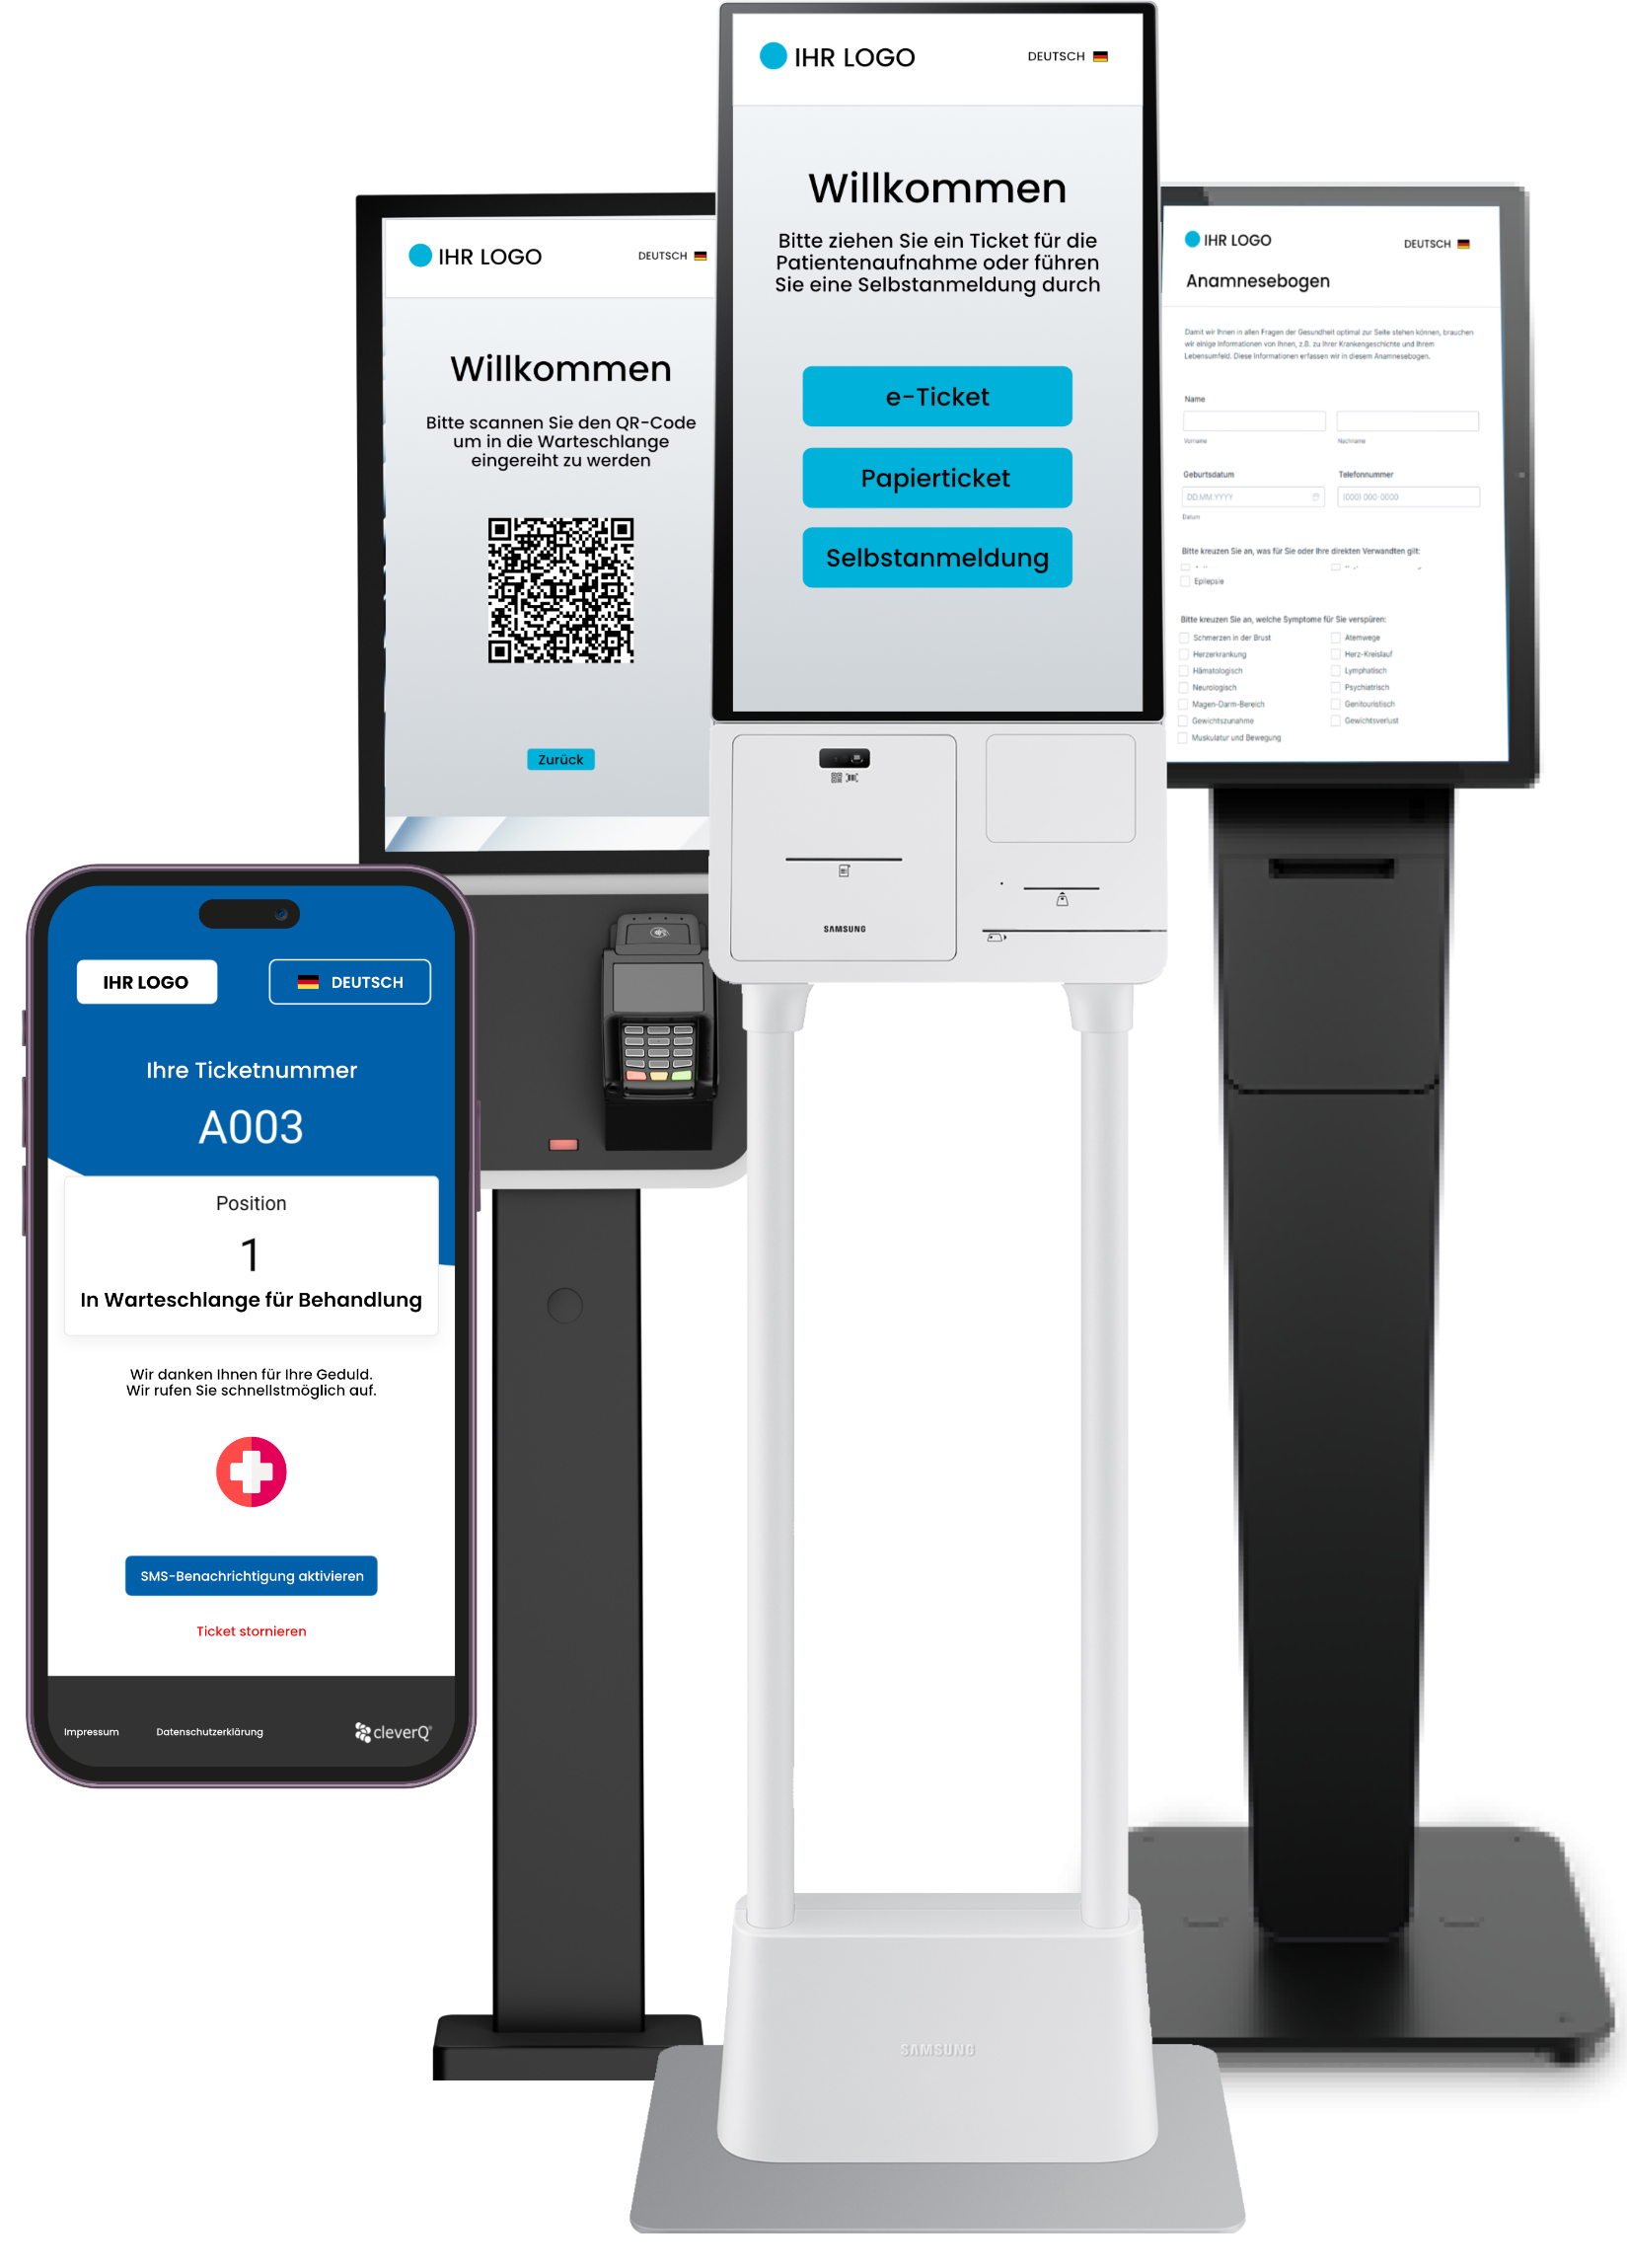
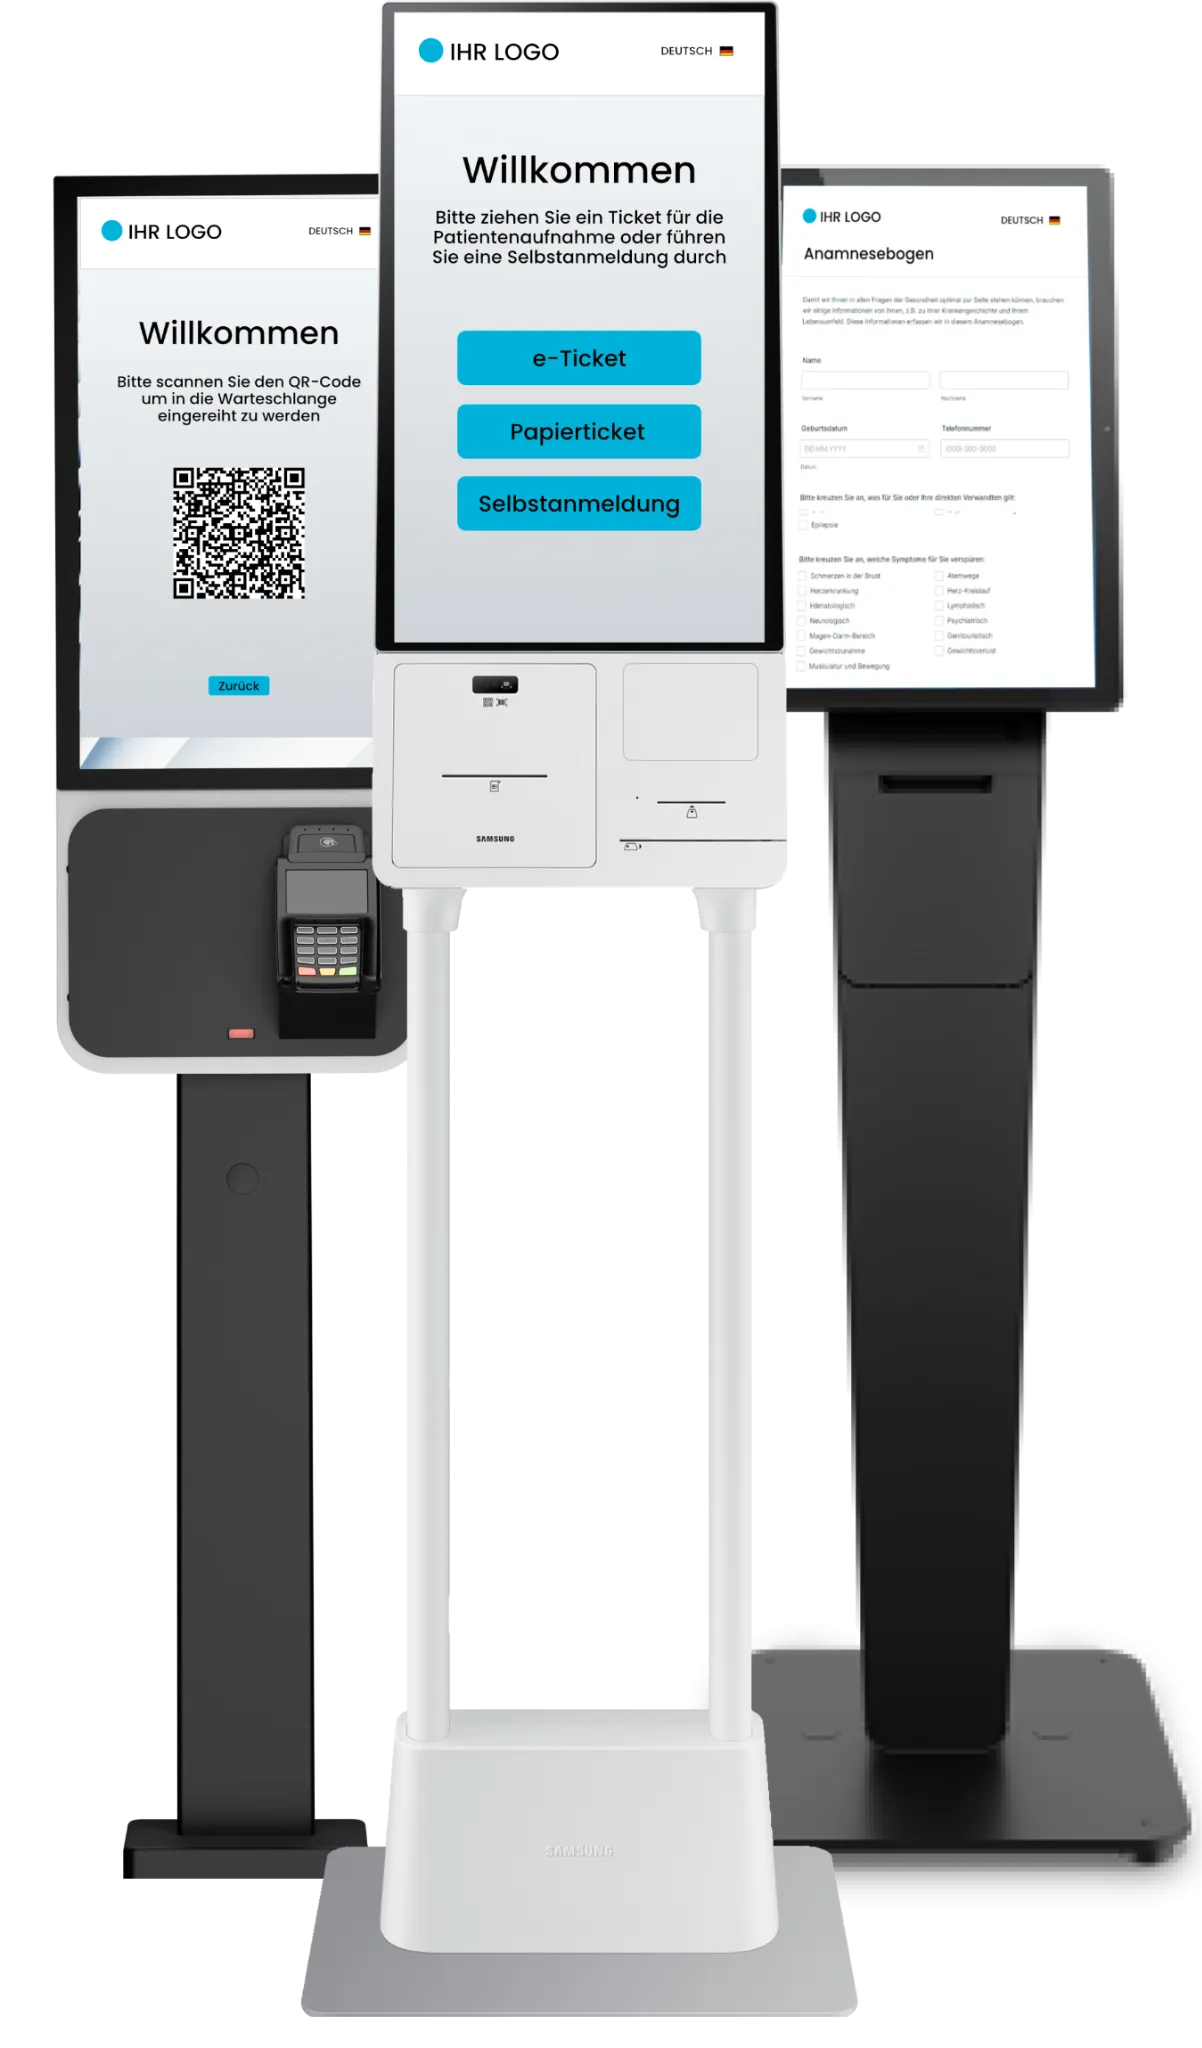
The optimal solution for efficient queue
management with complementary digital offerings
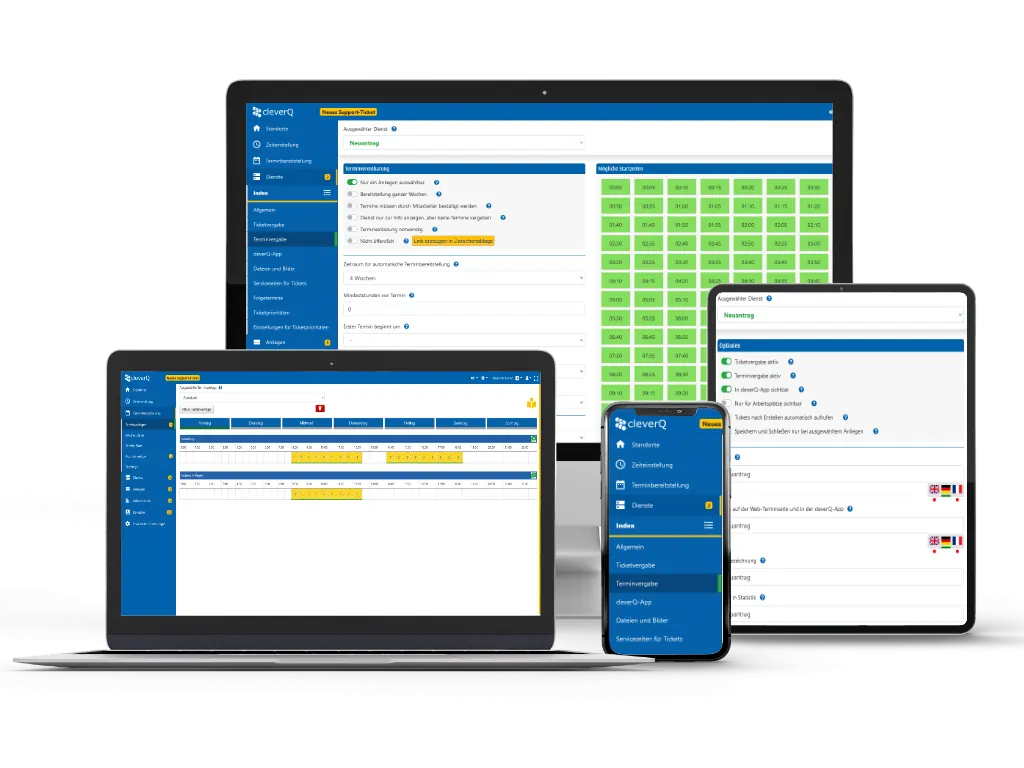
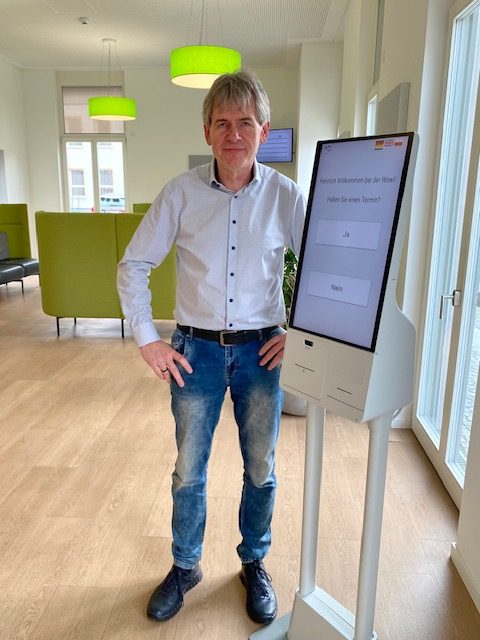
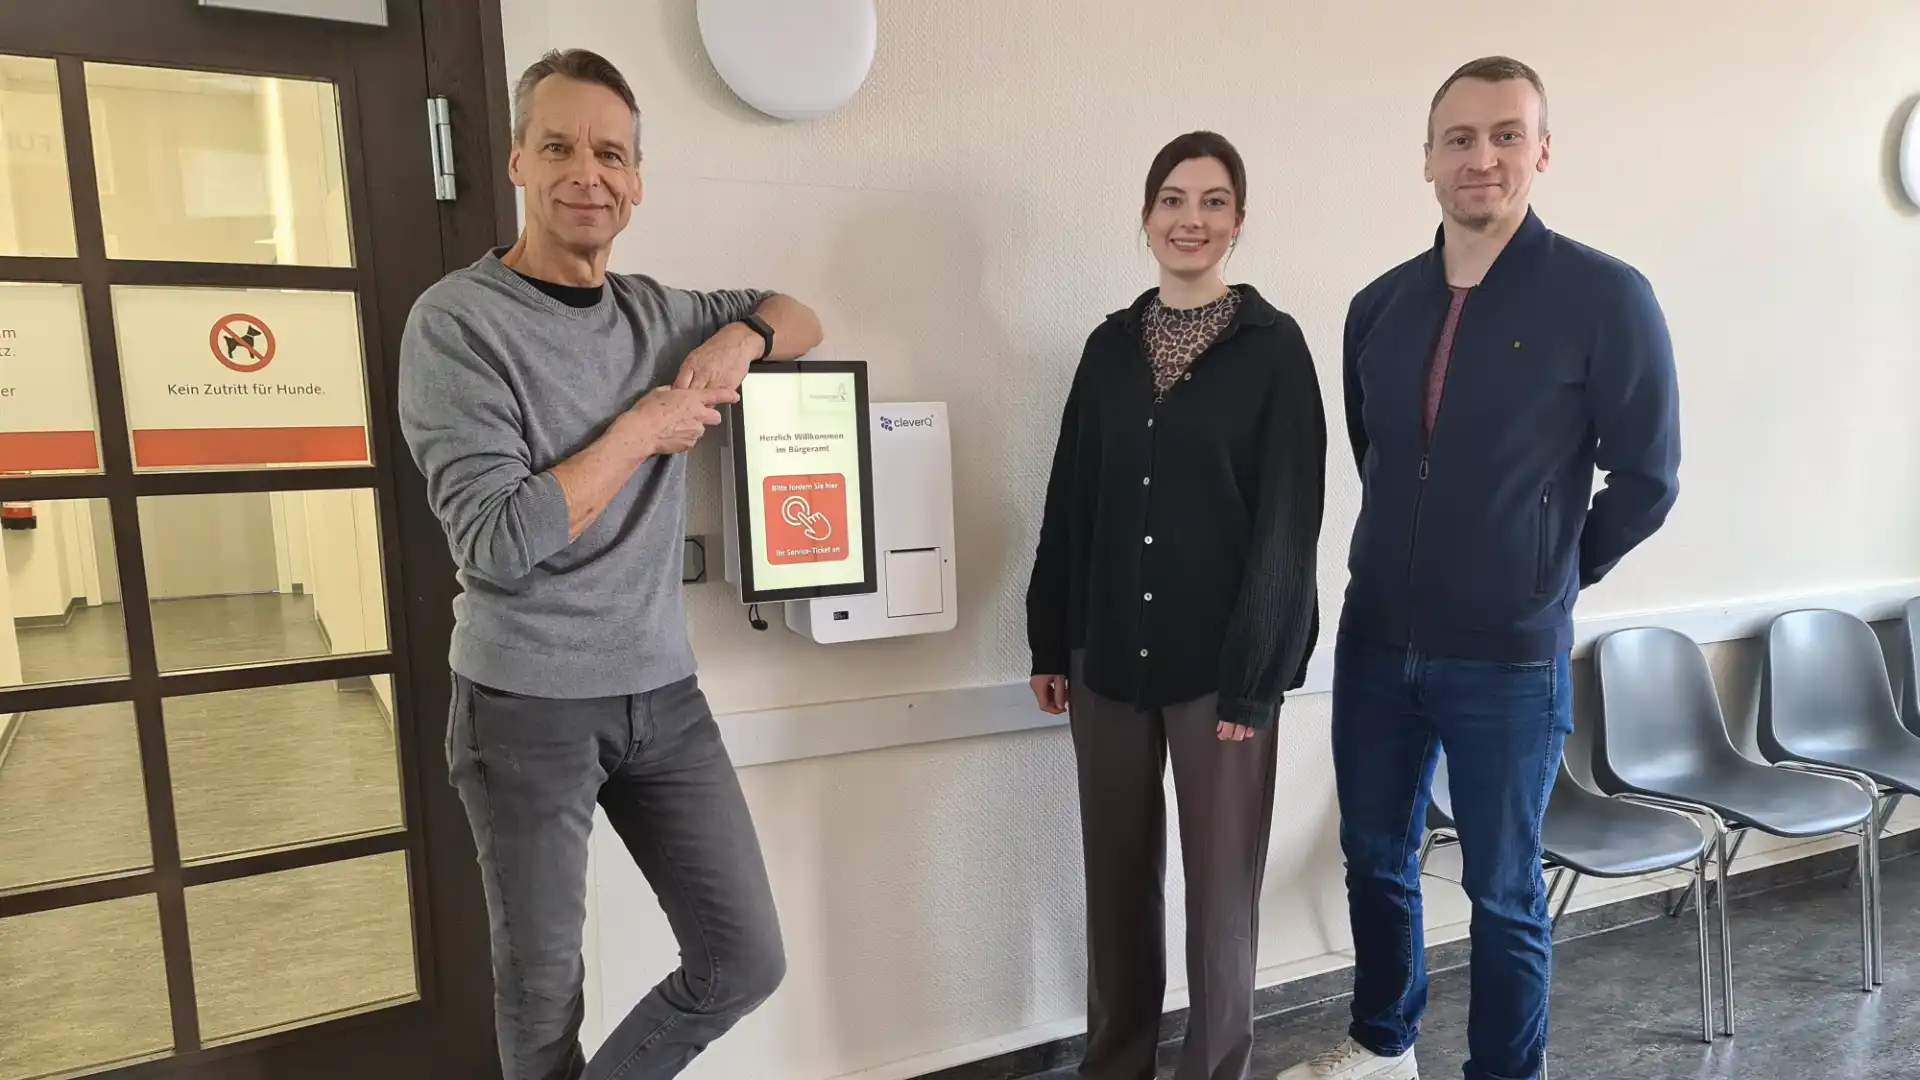
Whether modern, multifunctional kiosk systems or a stand-alone solution based on our free app and our web workstation. With cleverQ, you always opt for the best solution when it comes to queue management or organizing your appointments.
Are you interested in our queuing solutions? Simply contact our sales team for professional advice on your cleverQ solution of choice
Immediate added value for you and your citizens/customers. Uncomplicated, fair and modern – cleverQ
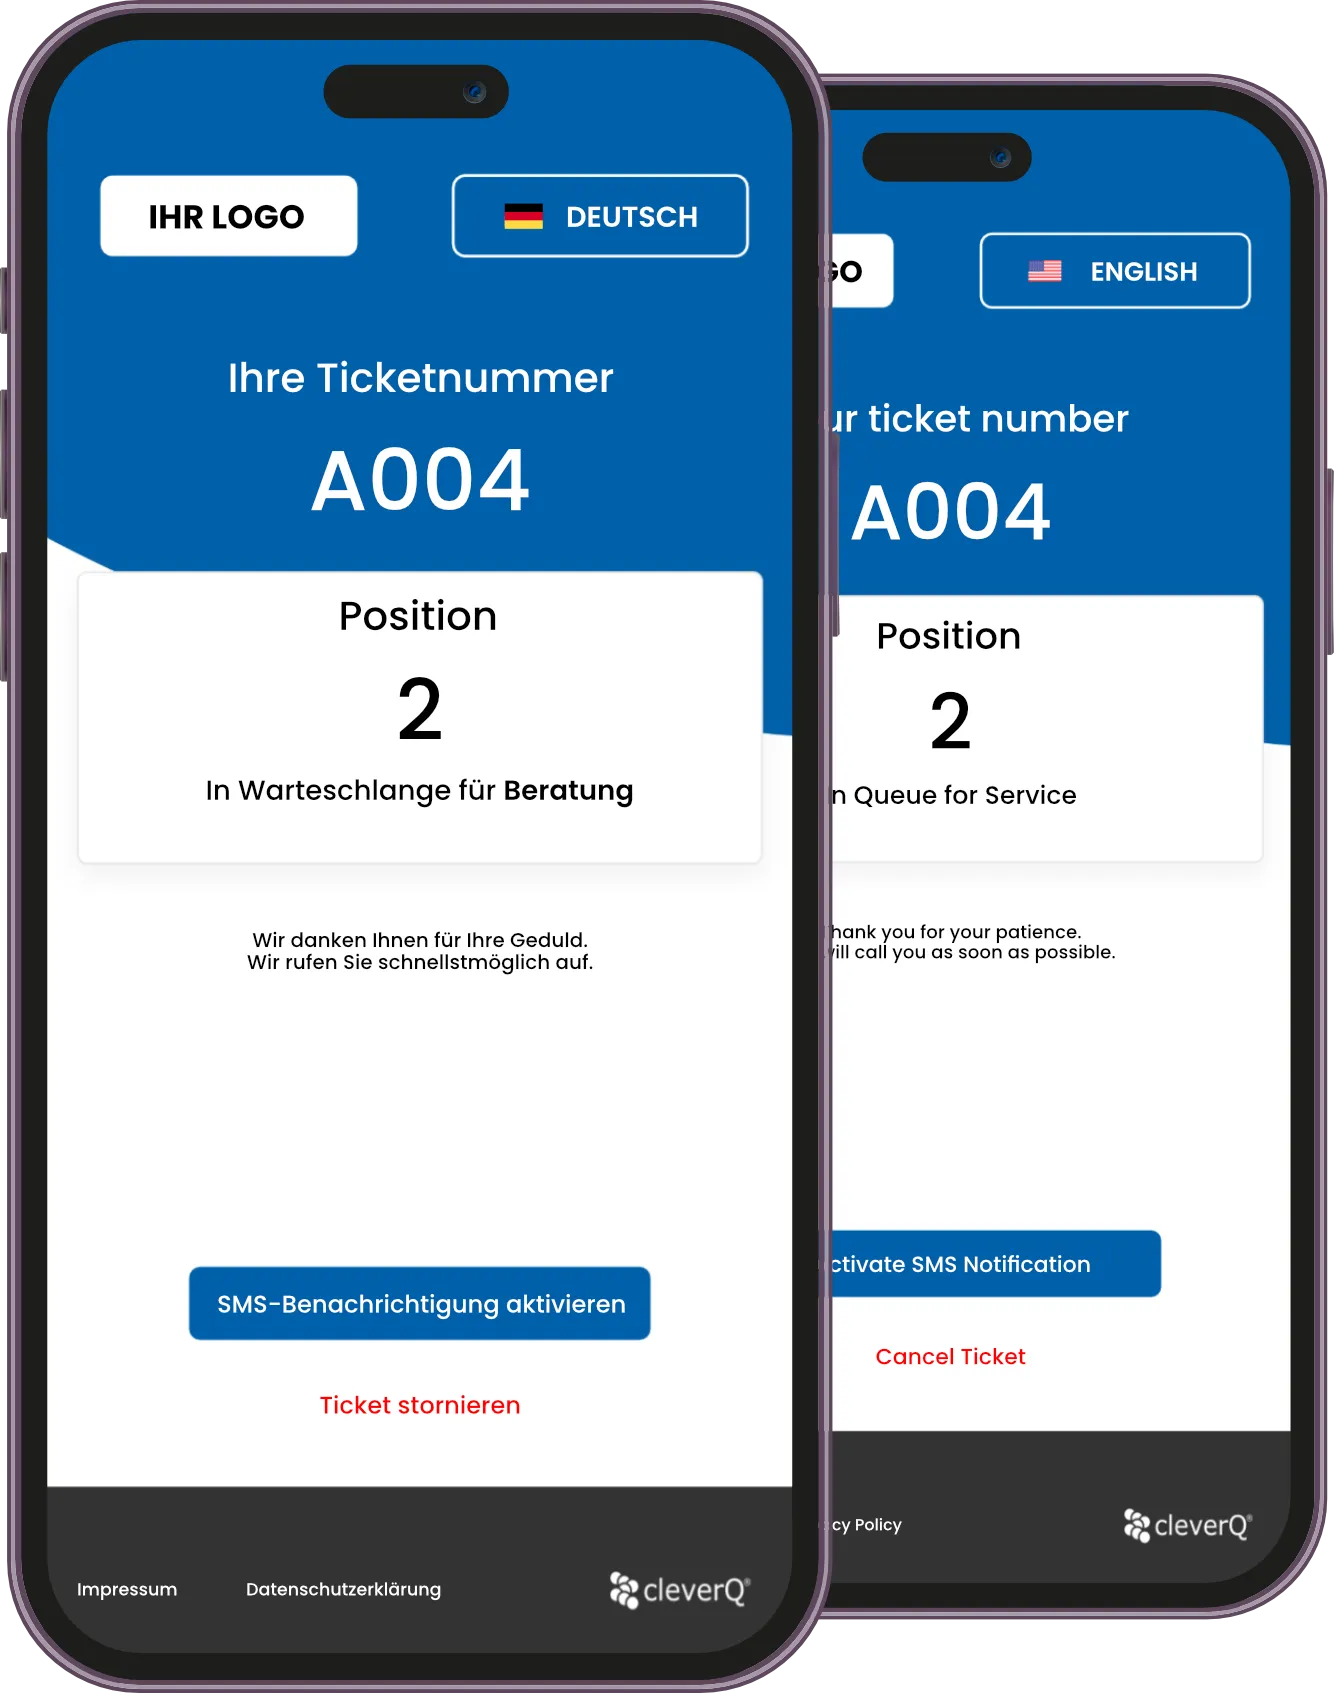
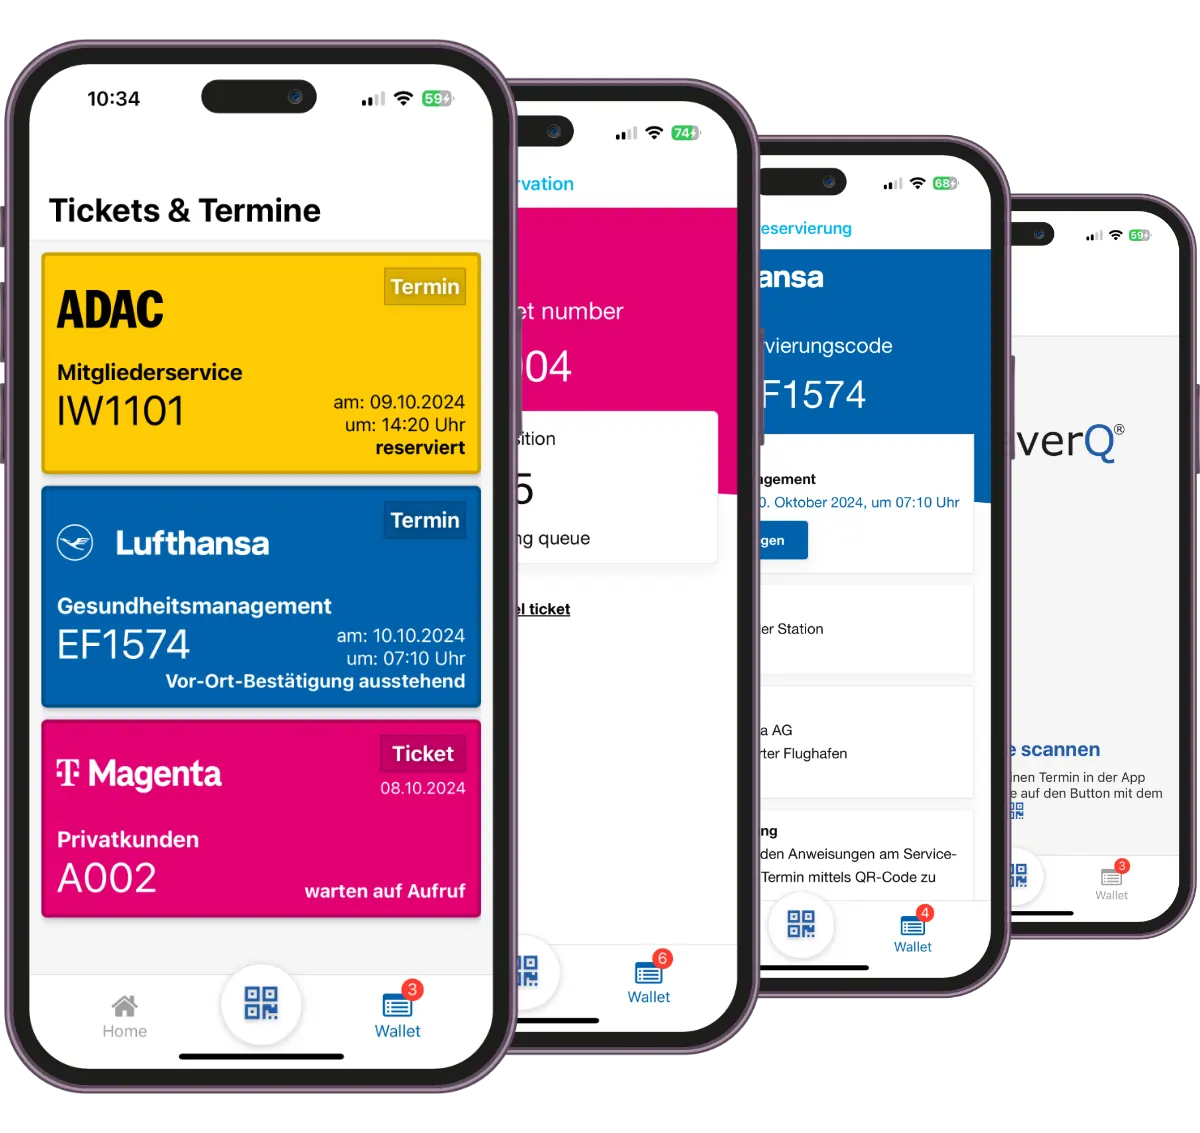
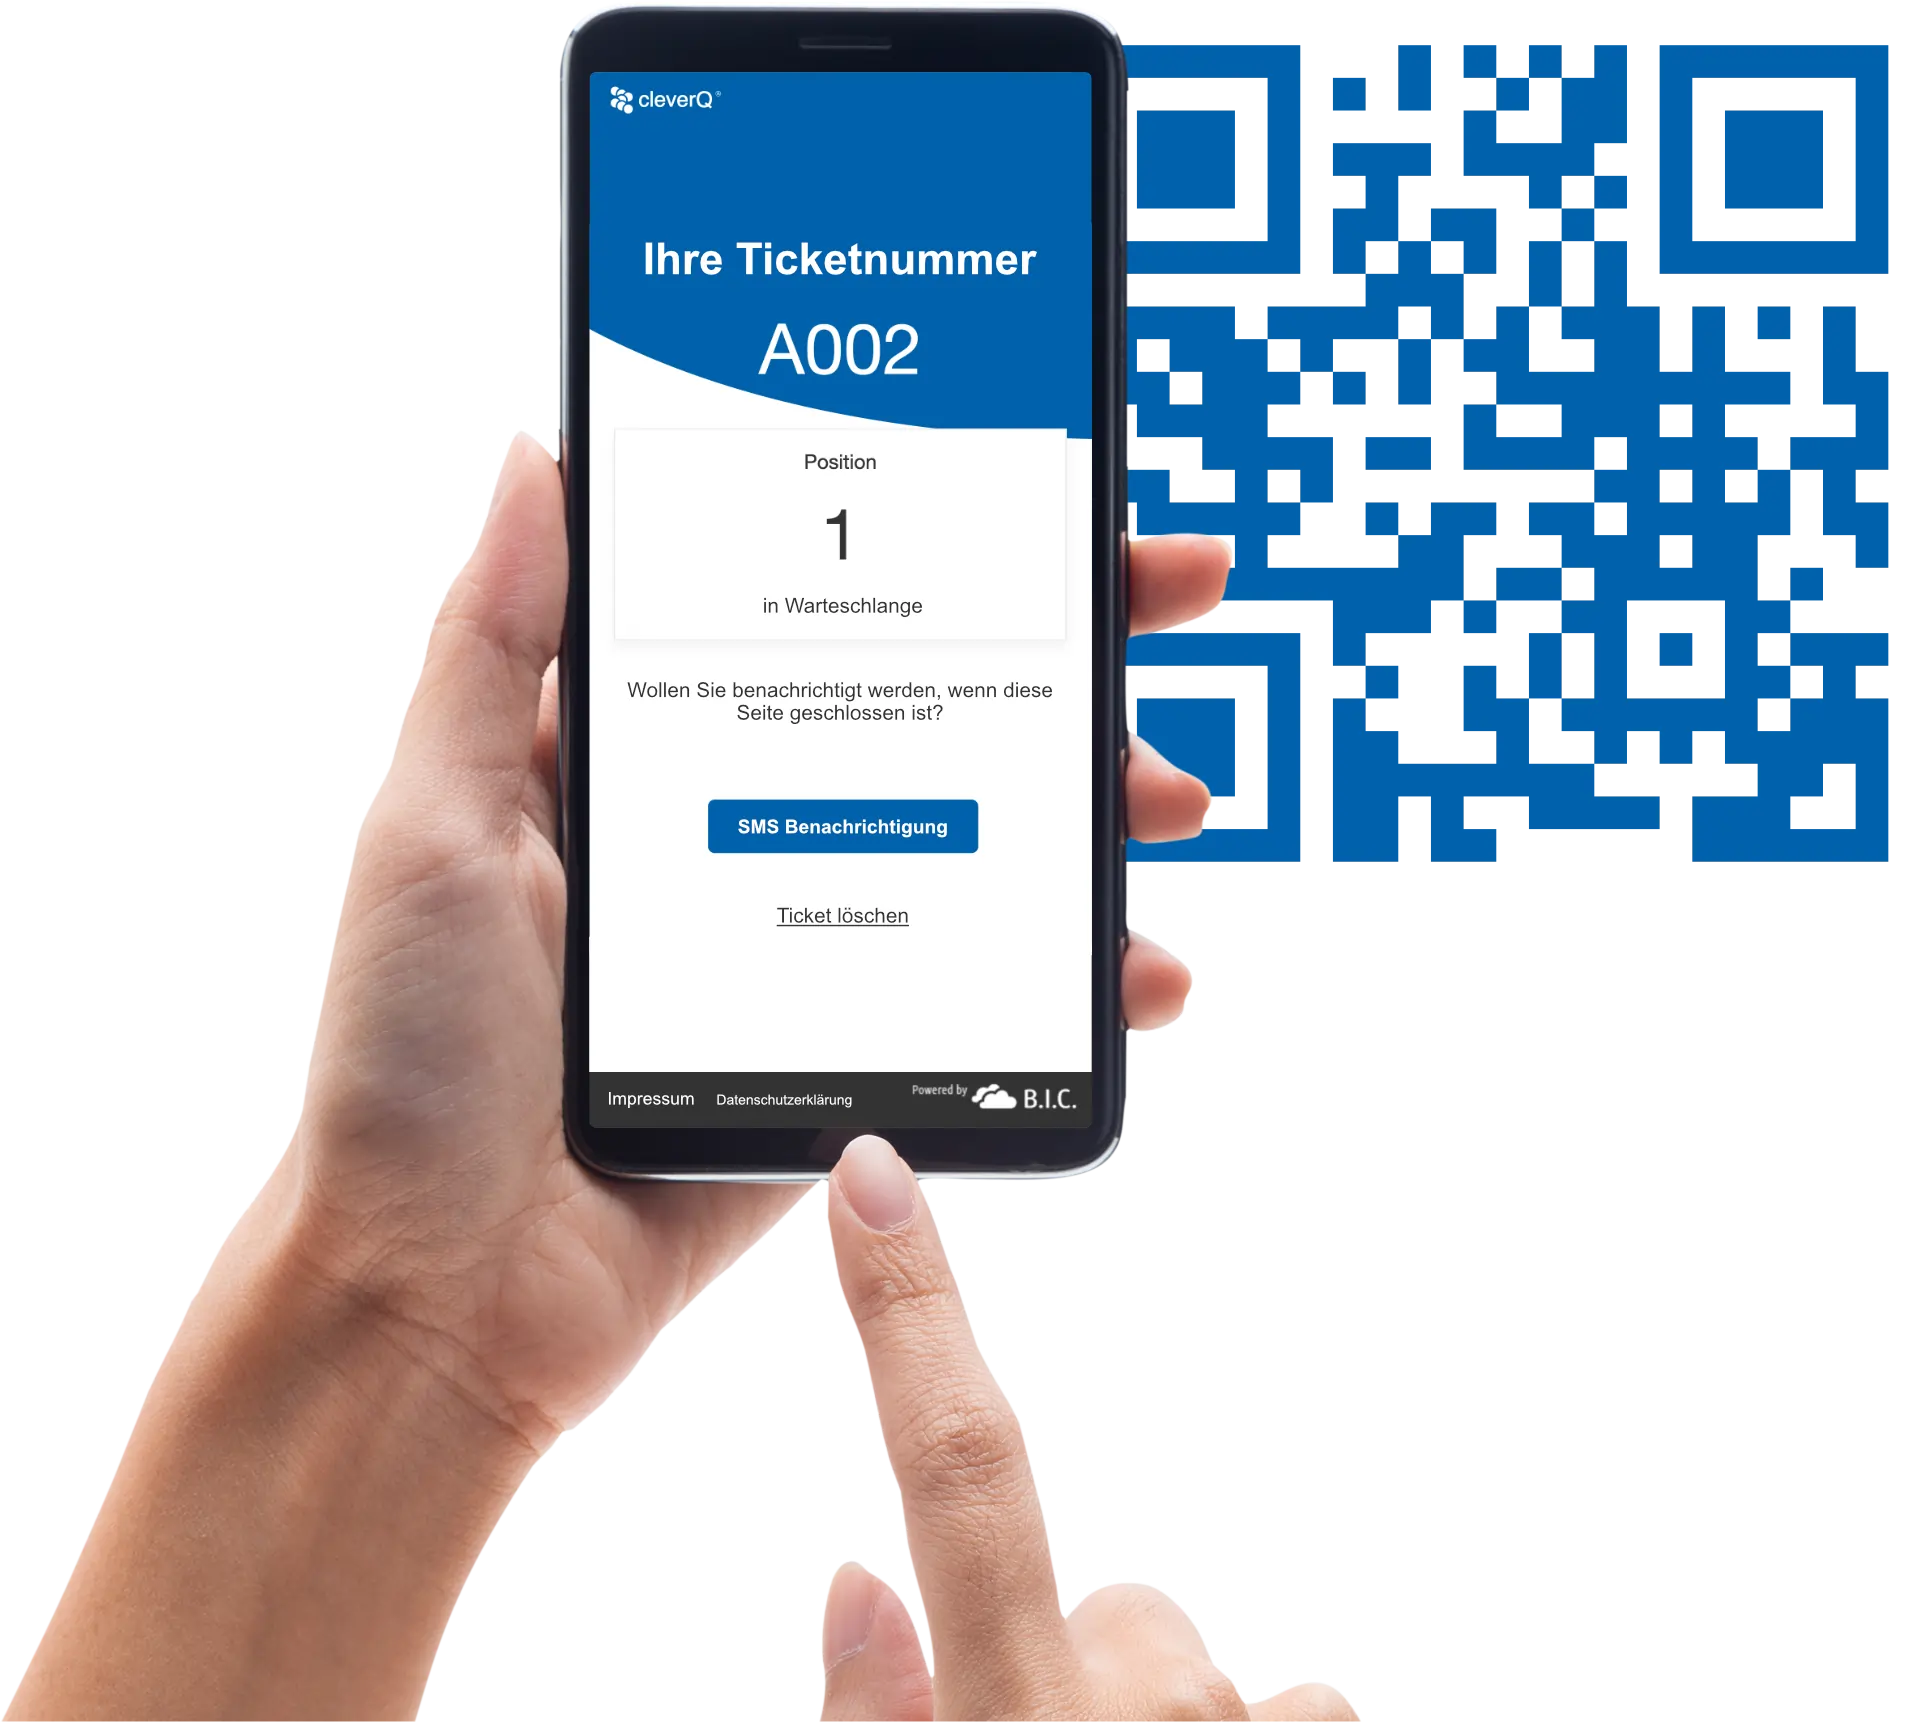
With cleverQ, appointment and walk-in customers are managed centrally via a single platform. The queue is always up-to-date, regardless of whether you use the ticket printer or digitally in the app.
cleverQ offers unlimited licenses for entire locations, with low monthly charges. Costs thanks to the SaaS principle
Reputable German hosters, compliance with all GDPR regulations, ISO 27001 certified company.
Our customers report first-hand on their experience with cleverQ solutions. Learn from successfully implemented projects how we help companies to optimize service, employee satisfaction and the customer journey.
We used to have to keep track of appointments and visitors separately. Today, everything runs via one system, which makes the processes much clearer and easier for us on a day-to-day basis.
Our experience has shown how important reliable cooperation is, even beyond the commissioning phase. We greatly appreciate the fact that the project managers from cleverQ were on site and ...
“cleverQ has made our patient flow clearer and more transparent. Patients navigate our facility more easily, and our team benefits from smoother, more efficient processes in day-to-day operations ...”

With cleverQ, we have created more structure and relief for both citizens and employees. Today, the process is clear, transparent and more relaxed. The employees decide ...

What we particularly appreciate about the cleverQ team is the partnership-based cooperation - always solution-oriented and at eye level. The cleverQ system has helped us exactly where we have needed it for years.
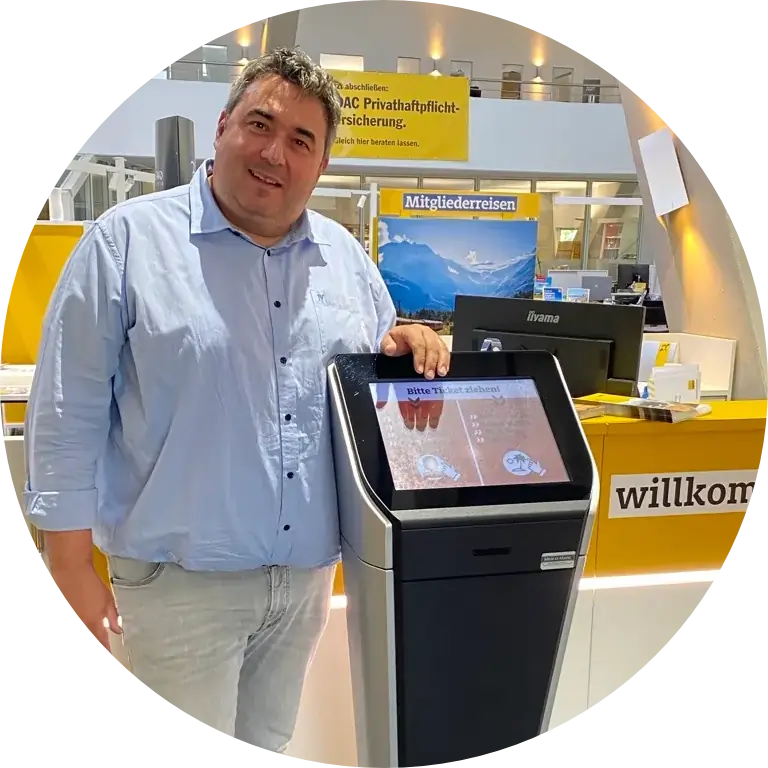
We are always on the lookout for new solutions to offer our customers the best possible shopping experience. The decision to use the cleverQ call system for our branch was therefore a ...

At SWP, service comes first. We wanted to transfer this service concept to the waiting room and make the stay as pleasant as possible for our customers ...

The cleverQ online appointment management system is used by the tax offices of the state of Schleswig-Holstein. Citizens can use it to easily book appointments online, either ...

We were looking for a simple solution for our test centers in order to optimize the process flows for the users or customers and our employees in the best possible way. I.e. short ...
You want to learn our products & services or better understand them? With interactive 3D maps we present our portfolio in a new way. Visual, modern, without much text and immediately understandable.
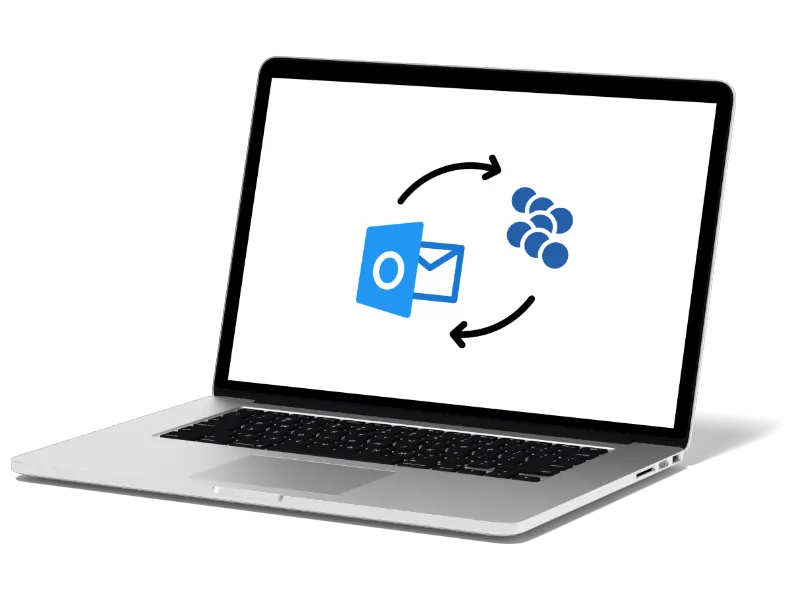
A major advantage of cleverQ is its flexibility and scalability. With extensions for your appointment
or call system, you can add useful functions quickly and with little effort.


You are currently viewing a placeholder content from Vimeo. To access the actual content, click the button below. Please note that doing so will share data with third-party providers.
More InformationYou are currently viewing a placeholder content from YouTube. To access the actual content, click the button below. Please note that doing so will share data with third-party providers.
More InformationYou need to load content from reCAPTCHA to submit the form. Please note that doing so will share data with third-party providers.
More InformationYou are currently viewing a placeholder content from Facebook. To access the actual content, click the button below. Please note that doing so will share data with third-party providers.
More InformationYou are currently viewing a placeholder content from Instagram. To access the actual content, click the button below. Please note that doing so will share data with third-party providers.
More InformationYou are currently viewing a placeholder content from Google Maps. To access the actual content, click the button below. Please note that doing so will share data with third-party providers.
More InformationYou are currently viewing a placeholder content from X. To access the actual content, click the button below. Please note that doing so will share data with third-party providers.
More Information